Analysis Section
Open Analysis when you need a quick read on the source image’s value range, hue balance, saturation, brightness, and color density while you work in any ToolBox lens.
What Analysis Shows
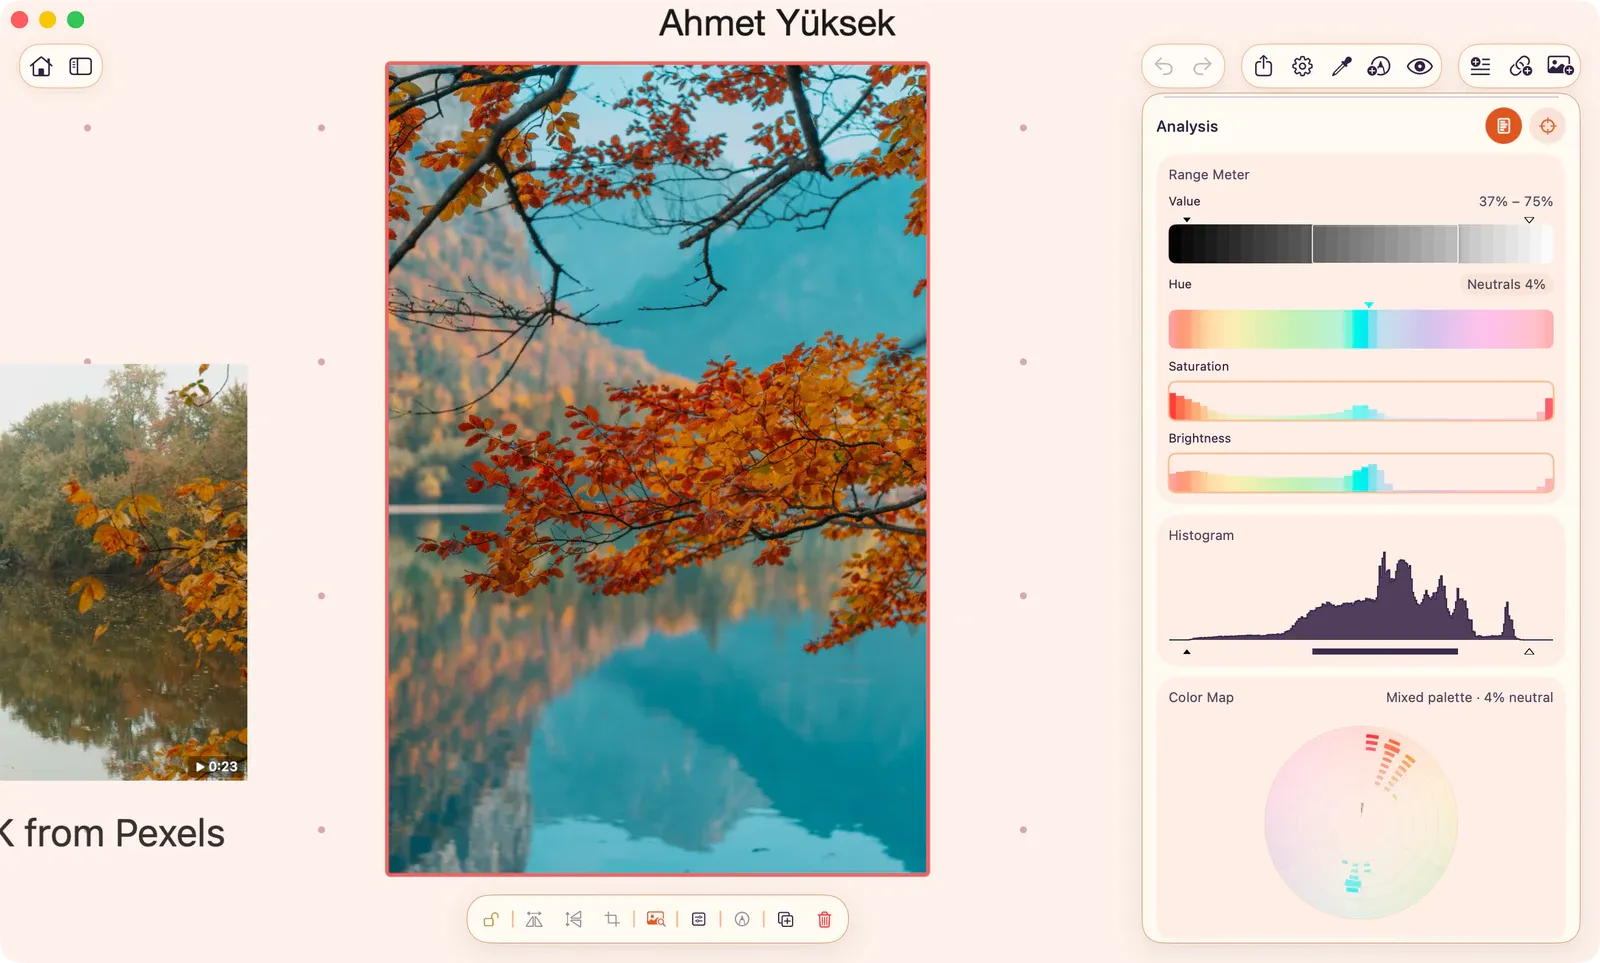
Section titled “What Analysis Shows”The Analysis section combines three diagnostic views from the current ToolBox source:
- Range Meter: Shows four compact meters: Value, Hue, Saturation, and Brightness.
- Histogram: Shows how pixels are distributed across the brightness range. The small markers show the darkest and lightest sampled values, and the filled strip shows the main bulk of the image.
- Color Map: Shows hue and saturation density in a polar wheel. Dense areas show where color families cluster; neutral bands show how much of the image is grayscale or near-neutral.
Analysis reads the selected image, GIF frame, or video frame. When another ToolBox tool is active, the Analysis section can still summarize the same source so you can compare the visible study with the underlying distribution.
Range Meter
Section titled “Range Meter”The Range Meter is split into four rows:
- Value: Brightness range from dark to light, with markers for the sampled minimum and maximum and a bulk-range label.
- Hue: Hue distribution, including neutral share and the dominant hue when one is clear.
- Saturation: Mean saturation by hue, useful for finding which color families carry the strongest chroma.
- Brightness: Mean brightness by hue, useful for seeing whether a hue sits mostly in shadows, midtones, or lights.
On Mac, hover the hue-related rows to inspect a hue bin. On iPhone and iPad, tap a hue bin to pin or clear the focus.
Focus Analysis with Scope
Section titled “Focus Analysis with Scope”Use Analysis Scope to draw a rectangle around the part of the image you want Analysis to sample. Drag the rectangle to reposition it, or drag its edges and corners to resize it.
Analysis Scope is separate from Tool Scope. A Tool Scope limits a specific tool such as Palette or Detail Density; Analysis Scope limits the Analysis section. If you already drew a Tool Scope, ArtDeck can use that rectangle as the starting point for Analysis Scope.
If Analysis Is Waiting
Section titled “If Analysis Is Waiting”If the preview is still updating, Analysis may show a progress indicator or the message Analysis will appear once the preview is ready. Wait for the preview to settle, or pause video playback on the frame you want to inspect.