Open ToolBox
Select an image, GIF frame, or video frame and open ToolBox to study it without changing the original board item.
Key Principles
Section titled “Key Principles”- Non-destructive: The source is never modified. All studies are read-only overlays.
- Live on board: Studies render directly on the board via the GPU, not in a separate window.
- Source-flexible: Works on still images, video frames (frozen at any timecode), and GIF frames.
- Snapshot to board: Create a new image item from the visible ToolBox study when you want to keep the result beside the source.
Opening ToolBox
Section titled “Opening ToolBox”- Select an image or media item.
- Press T or tap the ToolBox button in the control bar.
The ToolBox panel appears with five lenses and an Analysis section for value, hue, saturation, and brightness diagnostics.
Compact the Panel
Section titled “Compact the Panel”Press the ToolBox icon in the panel header to collapse the full panel while you study the item on the board. ArtDeck keeps the study active and leaves a compact ToolBox chip on the canvas with the current lens and tool.
Tap the compact ToolBox chip, or press the ToolBox button on the selected item’s control bar, to reopen the full panel.
Choose a Lens
Section titled “Choose a Lens”- Choose Values for tonal structure or notan checks.
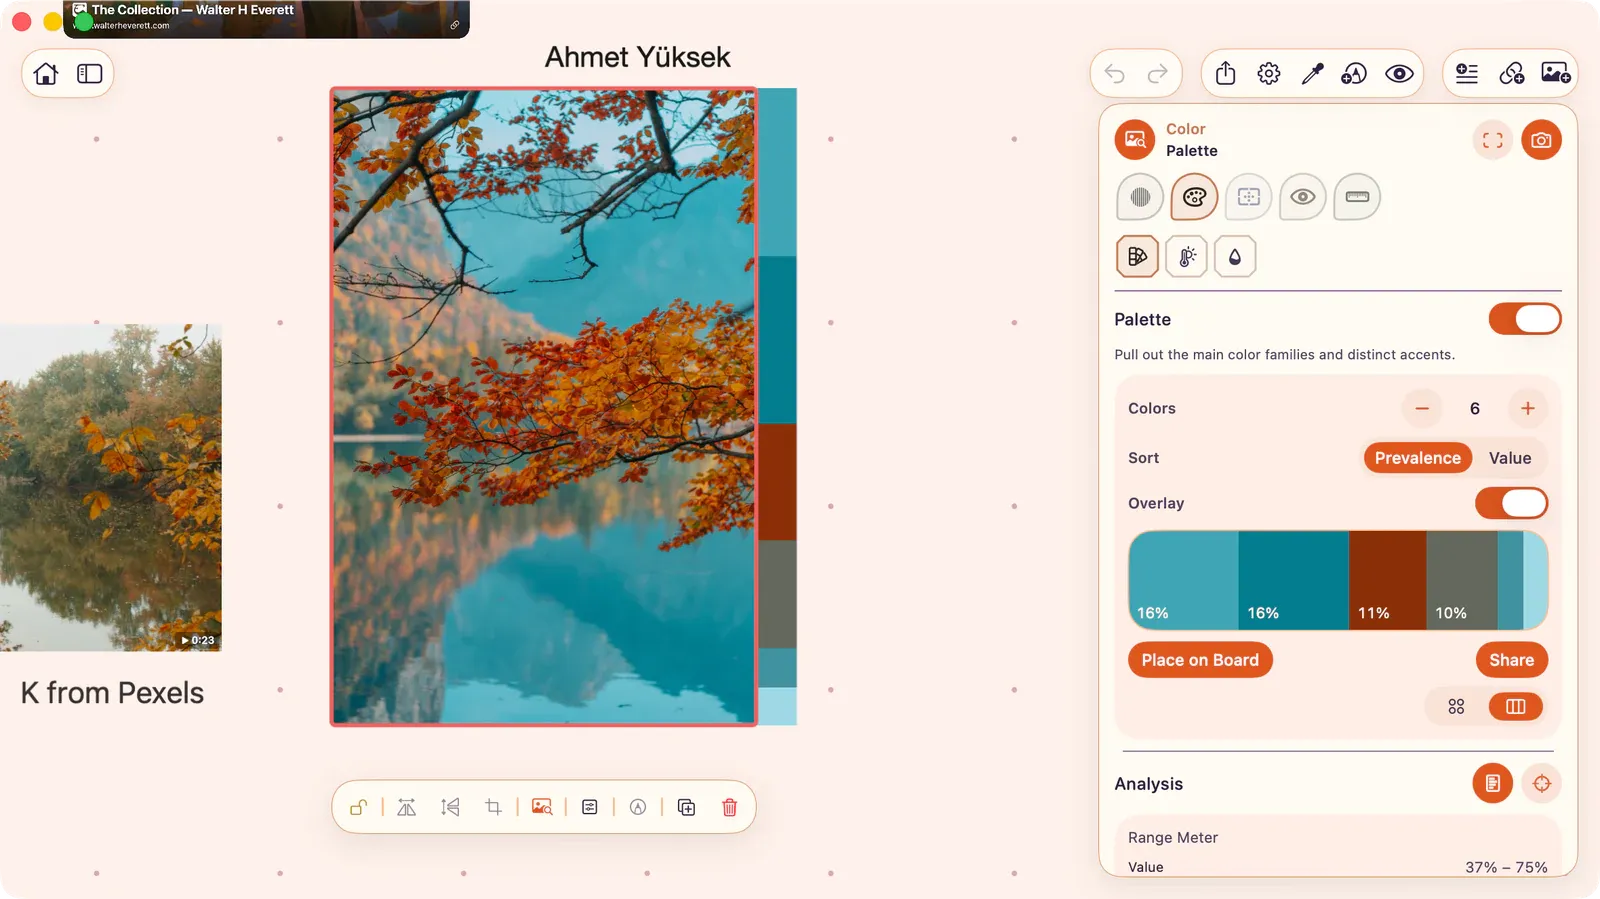
- Choose Color for palettes, temperature, saturation, or hue distribution.
- Choose Composition for guides, framing, symmetry, or thumbnails.
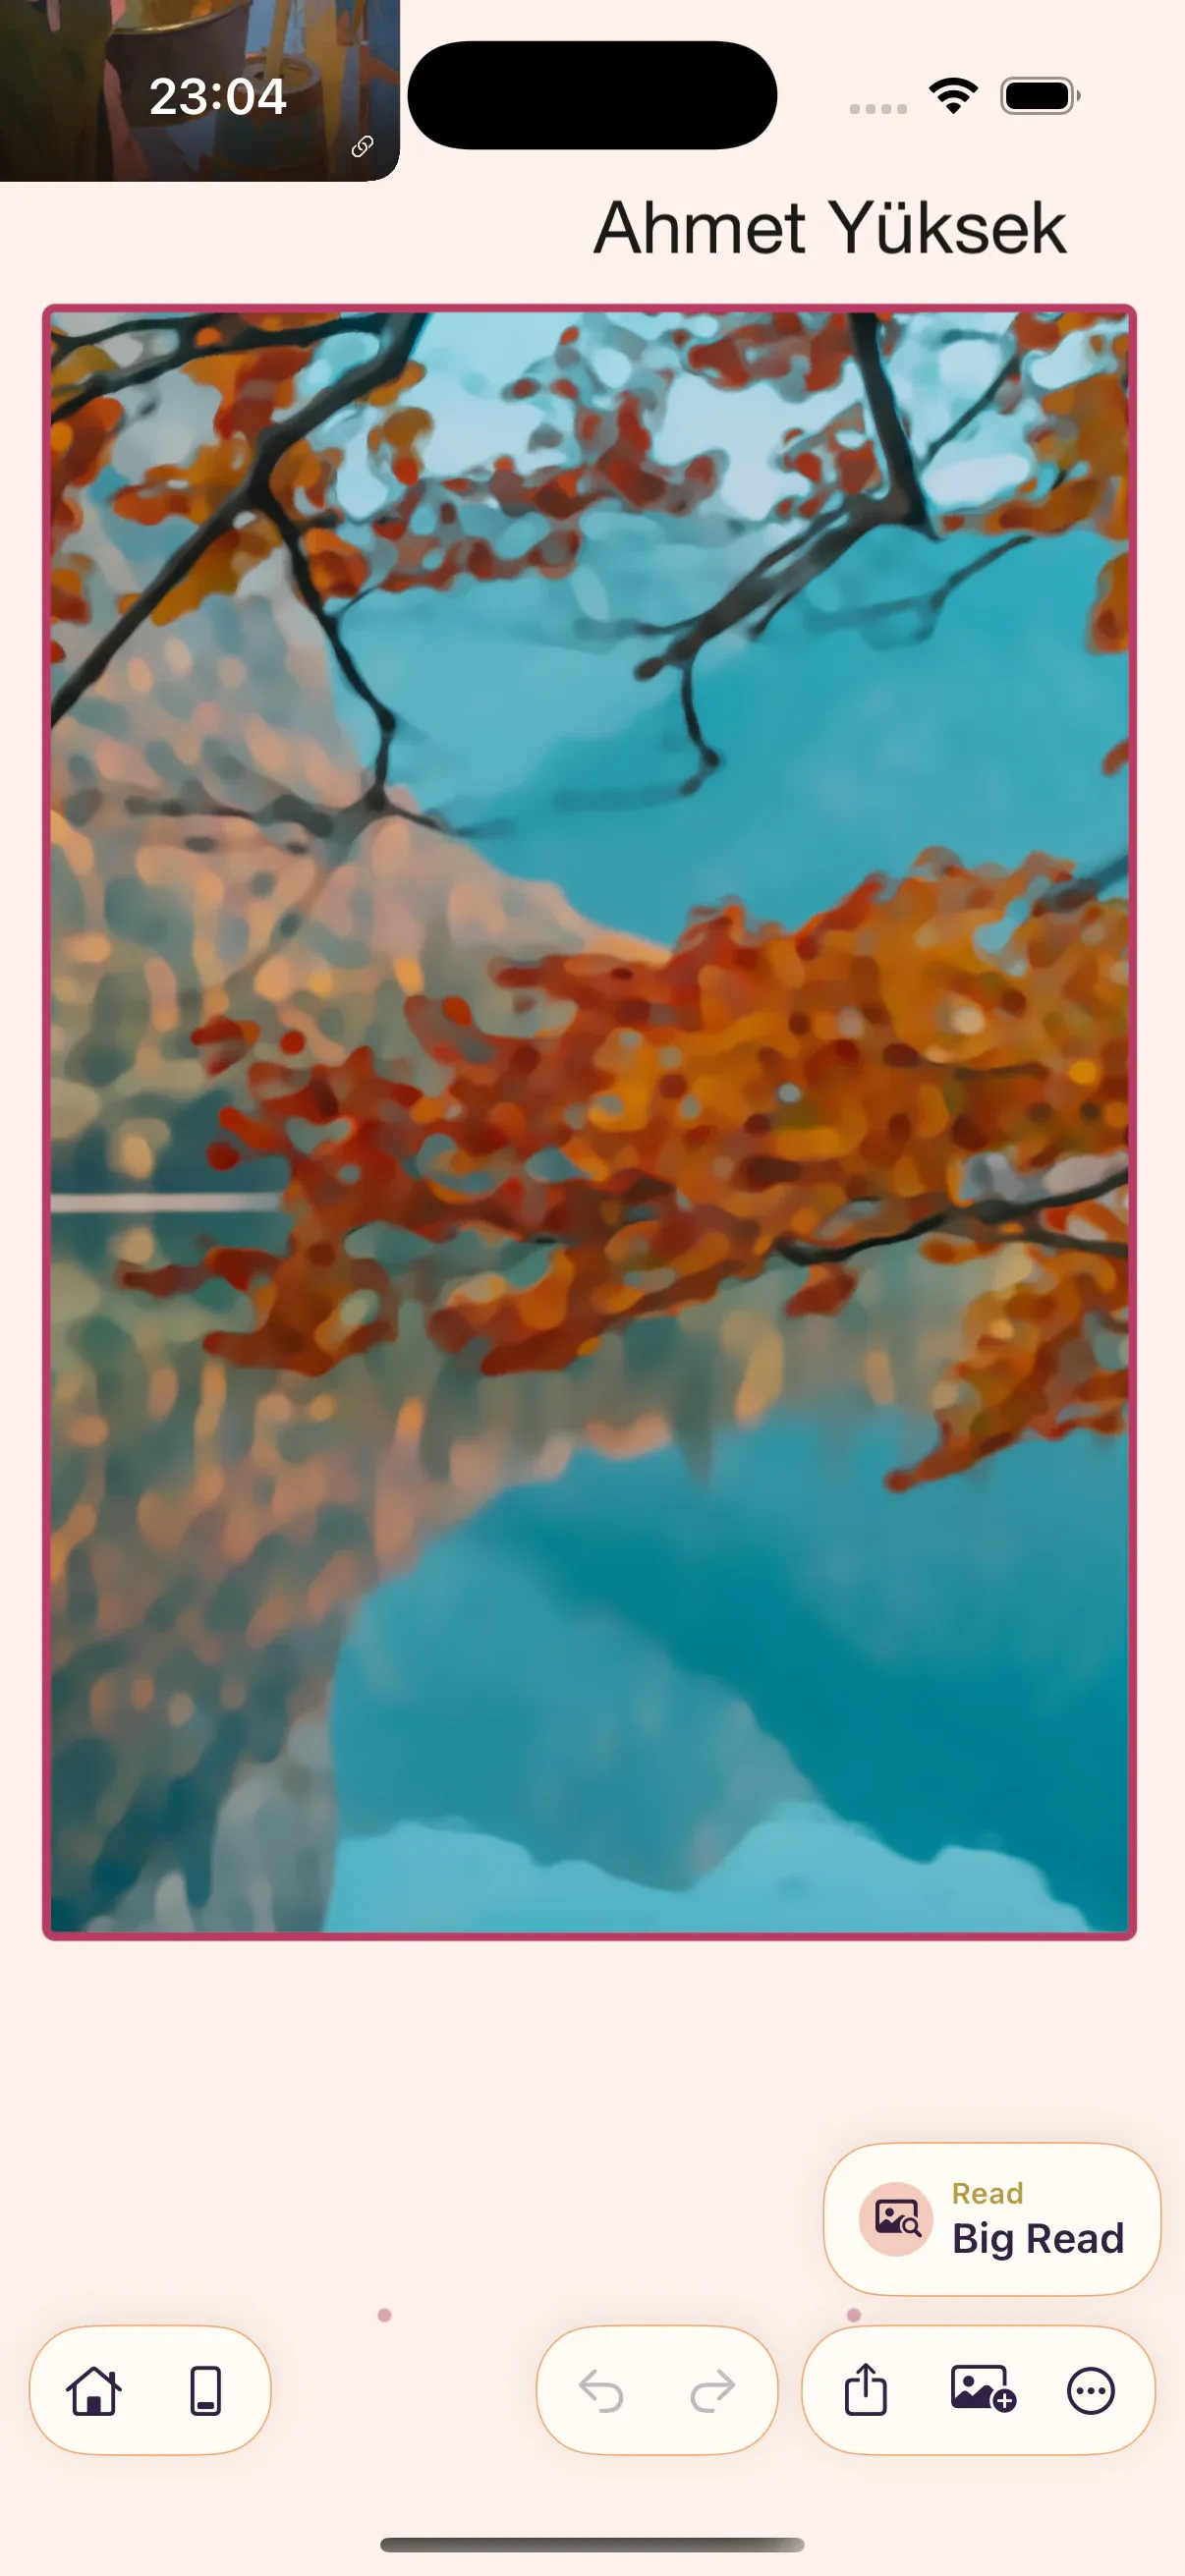
- Choose Read to simplify detail and check focal clarity.
- Choose Measure for plumb lines, angles, or ratios.
Lenses
Section titled “Lenses”| Lens | Purpose |
|---|---|
| Values | Tonal structure: lightness, contrast, value groupings |
| Color | Color relationships: palette, temperature, saturation |
| Composition | Framing, structure, and balance |
| Read | Simplify visual complexity for readability tests |
| Measure | Precision measurement on board |
Analysis Section
Section titled “Analysis Section”Open Analysis when you want the Range Meter, Histogram, and Color Map beside the active tool. The section stays in ToolBox while you move between lenses, so you can compare the current study with the source’s value and color distribution.
Snapshot to Board
Section titled “Snapshot to Board”Tap the camera button in the ToolBox header to create a board item from the current ToolBox result.
- Most tools: The button is labeled Snapshot to Board and inserts the visible study result as a new image item.
- Thumbnail Sheet: The same button is labeled Create Thumbnail Sheet and inserts the selected sheet variants.
The original image, GIF, or video item is not changed. Snapshot the result when you want to keep a study state on the board, compare it beside the source, or include it in a board export.
Source Types
Section titled “Source Types”| Source | Behavior |
|---|---|
| Still images | Full-resolution analysis |
| Video | Freezes the current frame at a specific timecode |
| Animated GIF | Freezes a specific frame |
Tool Settings
Section titled “Tool Settings”All tool parameters (sliders, toggles, pickers) are saved per board. Last-used tool per lens is remembered during the session.
If an Overlay Is Missing or Slow
Section titled “If an Overlay Is Missing or Slow”| Situation | What to try |
|---|---|
| No overlay appears | Confirm an image, GIF frame, or video frame is selected and that the active tool has an overlay enabled. |
| Overlay shows the wrong area | Clear or redraw Scope if a focused region is active. |
| Video analysis is slow | Pause on the frame you need or snapshot the frame to the board before running the lens. |
| Result is hard to read | Reduce blend/opacity, switch tools, or snapshot the result so you can compare it beside the source. |