Color Lens
Open the Color lens to extract palettes, inspect temperature and saturation, and compare color distribution. Open Analysis when you need value, hue, saturation, and brightness diagnostics beside these color tools.
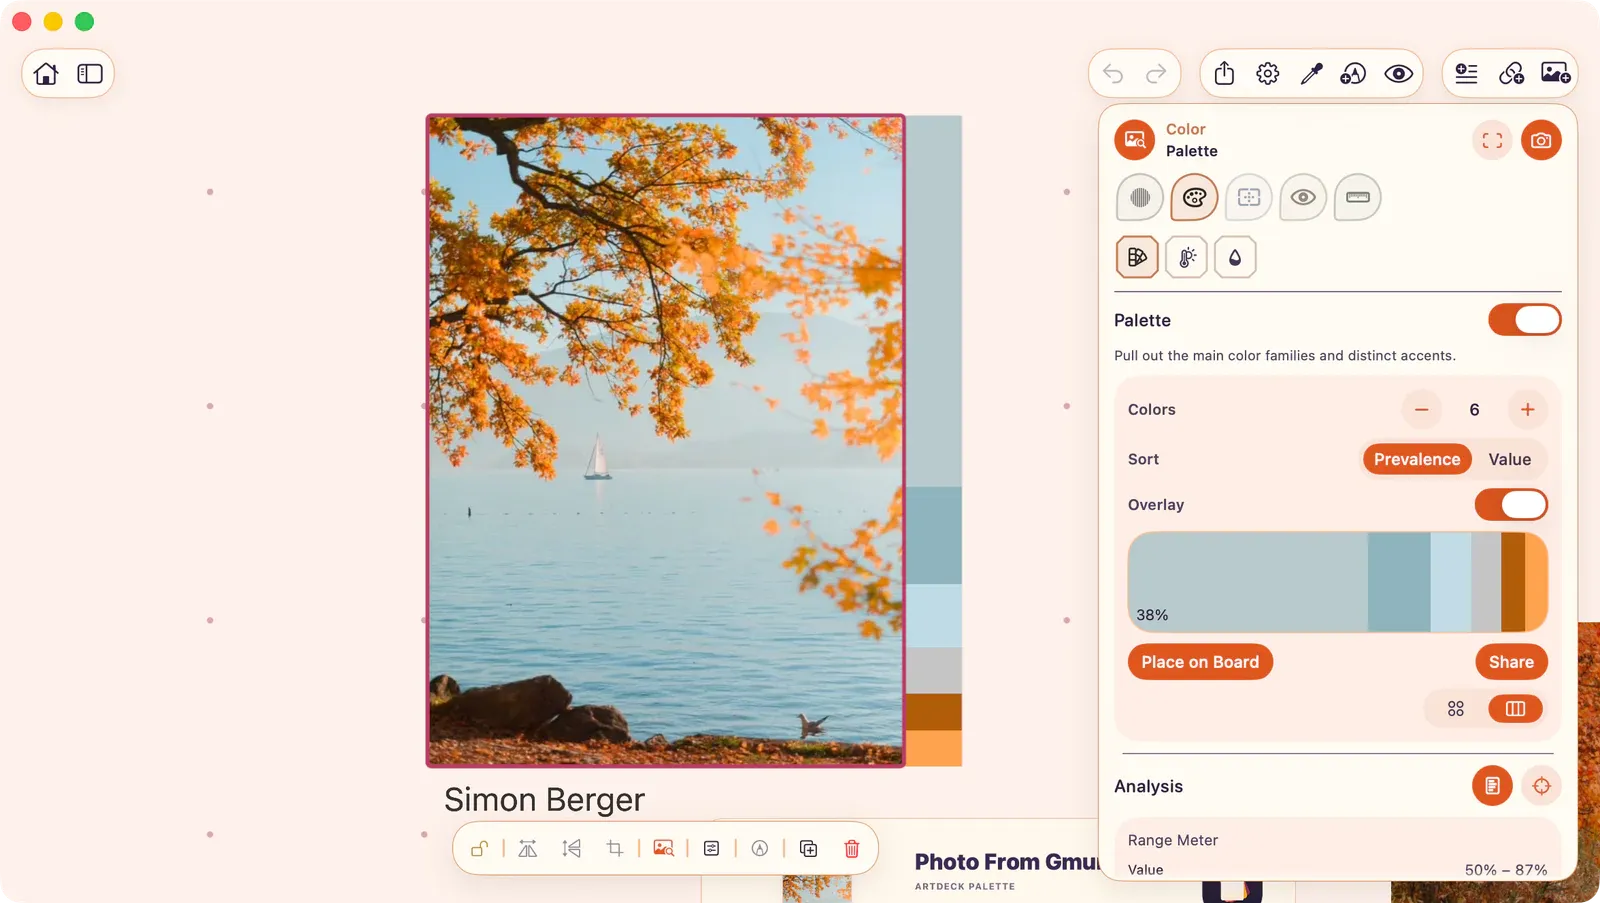
Palette
Section titled “Palette”Extract dominant color families from the source image, then copy hex values or place palette artifacts back on the board.
- Colors: 3 to 7 dominant colors via K-means clustering.
- Views: Swatches (circles with percentages) or Barcode (linear strip).
- Sort: By prevalence or by value.
- Overlay: Toggle between Hidden (no canvas overlay) and Color Strip (a strip of dominant palette colors rendered over the image edge).
- Place on Board: Create a palette card with the source name, source preview, dominant swatches, hex labels, prevalence percentages, and Range/Bias summaries.
- Share: Send the generated palette card PNG through the system share sheet.
Swatches
Section titled “Swatches”Tap a palette swatch to inspect it. The detail strip shows the swatch color, hex value, RGB value, prevalence percentage, and two actions:
- Copy Hex: Copy the swatch hex value.
- Add to Board: Create a swatch card on the board for the selected color.
You can also drag a swatch from the swatch grid or barcode strip onto the board. Dropping it on the canvas creates a swatch card at that position; dropping it over a group places it in that group.
Supports Scope for focused analysis.
Temperature Map
Section titled “Temperature Map”Maps warm and cool color balance across the image.
- Scene Lighting: Cool Light, Daylight, or Warm Light calibration.
- Sensitivity: Adjustable color separation strength.
- Blend: Control overlay intensity.
Saturation Map
Section titled “Saturation Map”Maps where vivid and muted color energy lives in the image.
- Highlight Range: Focus on accent colors.
- Contrast: Adjustable curve.
- Blend: Control overlay intensity.